Deliverando: A Business Intelligence Project
I chose this topic for one of our last coding challenges at the bootcamp of Spiced Academy to get even more hands-on experience with business intelligence and sales analytics. The project did prove to be challenging in the amount of cleaning and filtering needed but also rewarding, leading to a lot of discoveries. I uncovered a lot of positive signs and improving KPIs but also somme challenges to be followed in the future.
The Python code for this project is available in the deliverando_business_intelligence.ipynb notebook in the GitHub repository.
Summary
-
Cleaning and combining data from CSV and Excel with Pandas.
-
Combining data sets and analysis. KPIs, business intelligence (Pandas, SciPy).
-
Easy-to-read visualizations (Seaborn).
-
Selection of core information to present to stakeholders.
-
Bonus: Anonymization of restaurant names before publishing the project on this website (Faker).
The data
Two data files were provided by the bootcamp organizers: a file about sales at Deliverando, featuring a variety of KPIs for different restaurants using the delivery service, and a file about competition, listing the sales per restaurant. The data was available only for two months, allowing only limited time analysis.
Probably the main obstacle in the cleaning process were geographical locations in restaurants and the presence of restaurant chains with more than one franchises. For example, I discovered some suspicious records about restaurants which might have been located outside of the interest area (Graz region, Austria). Since I could not ask the data collectors, I decided case by case if the restaurants should be included in the analysis based on other related information and documented my decision.
Because the data sets contained real restaurant names, I anonymized them using Python's Faker library, while in the same time attempting to generate German-sounding restaurant names. The code is documented in the anonymization.ipynb notebook in the GitHub repository.
It was also necessary to carefully decide, if the restaurants in chains should be considered as individual places or rather as companies and if some KPIs should be summed up or averaged as the result. The decision depended mainly on the purpose and to some extent on the availability of data. In the end I decided to present the overall results for chains which were more relevant to the analysis.
The tasks and analysis
What is the state of business in Graz for Deliverando?
-
What can we say about relevant KPIs?
-
How many restaurants are active on Deliverando or our competitors and how much have the respective platforms grown?
-
Which 10 restaurants have placed the most orders with our competitors and how are they doing on Deliverando?
In the course of the analysis, I performed grouping in the Deliverando data frame to derive the overall KPIs, pivoting to apply the df.describe() method to get more statistical insights, A/B testing and a lot of filtering. I used Pandas and SciPy in this part. One of the results is TOP10 competitor's restaurants and their performance under Deliverando (Fig 1).
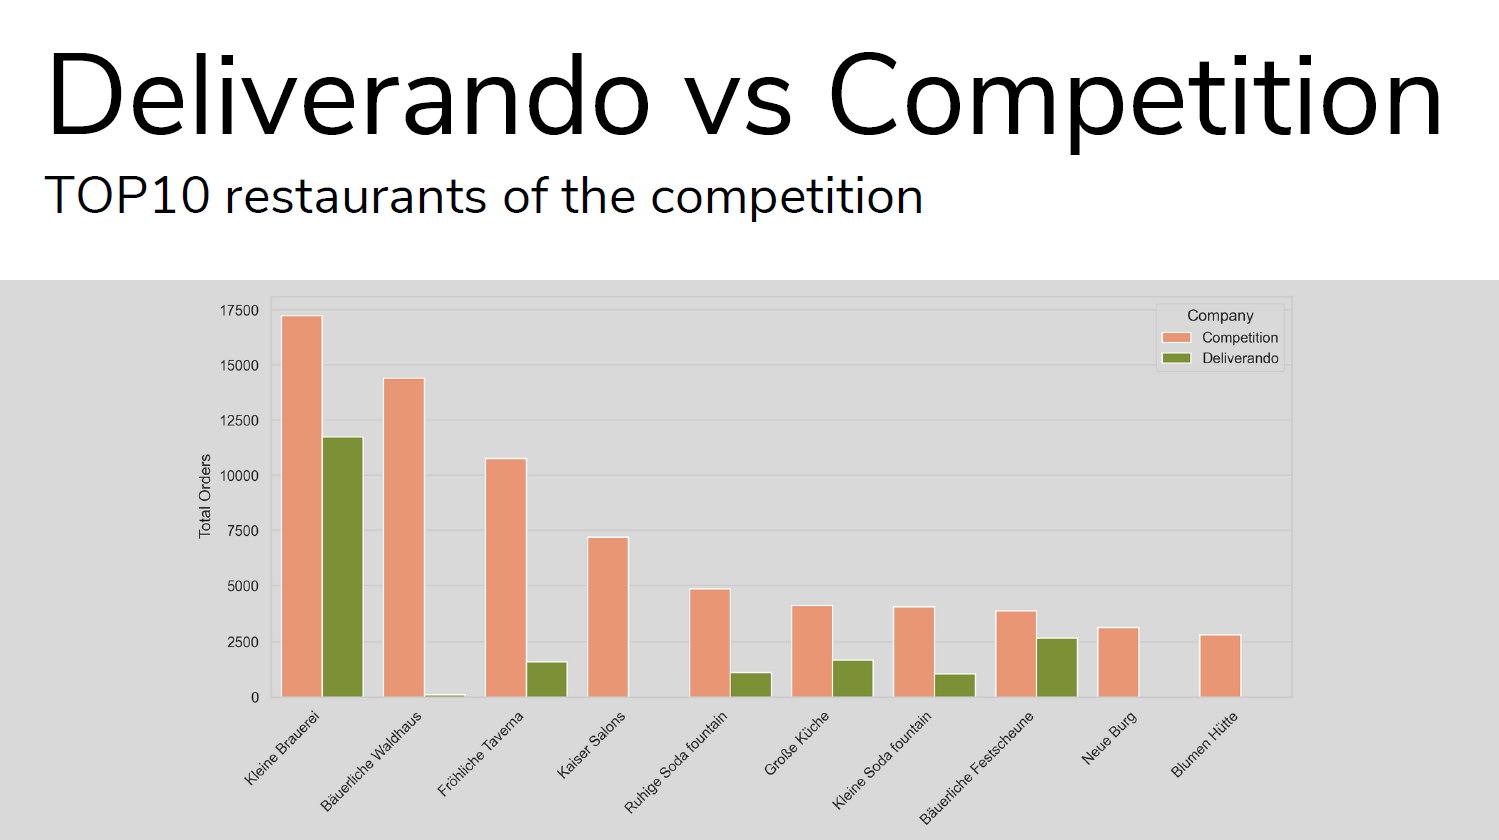
Fig 1. TOP10 restaurants by sales for competition and their sales at Deliverando. In this sample, Deliverando is lacking behind, but this means nothing else but room for improvement!
Visualizations
For a lightning talk in front of stakeholders, I decided to produce beautiful and simple plots in Python's Seaborn library, one monthly comparison for each relevant KPI as bar charts and some pie charts to see how the market share of our company and competitors changed between months. Any topic, including food delivery, is an exciting challenge when it comes to presenting analysis results to a non-technical audience. I hope that you will find my way easy to grasp and entertaining, the only thing you must do is check the final presentation. Alternatively, go through some of the results in the following paragraphs.
Results
See some examples of the results below, showcasing the good trajectory our company is taking in Graz and the example of improving KPI (Fig 2 - 4). Also some challenges are present, demonstrated by the fast growing competition. The p-value in Fig 3 tells us that this result is on the brink of statistical significance, and we should pay attention to this measure in the future to look for trends. All in all, I always attempt to communicate in a smooth and unified way.
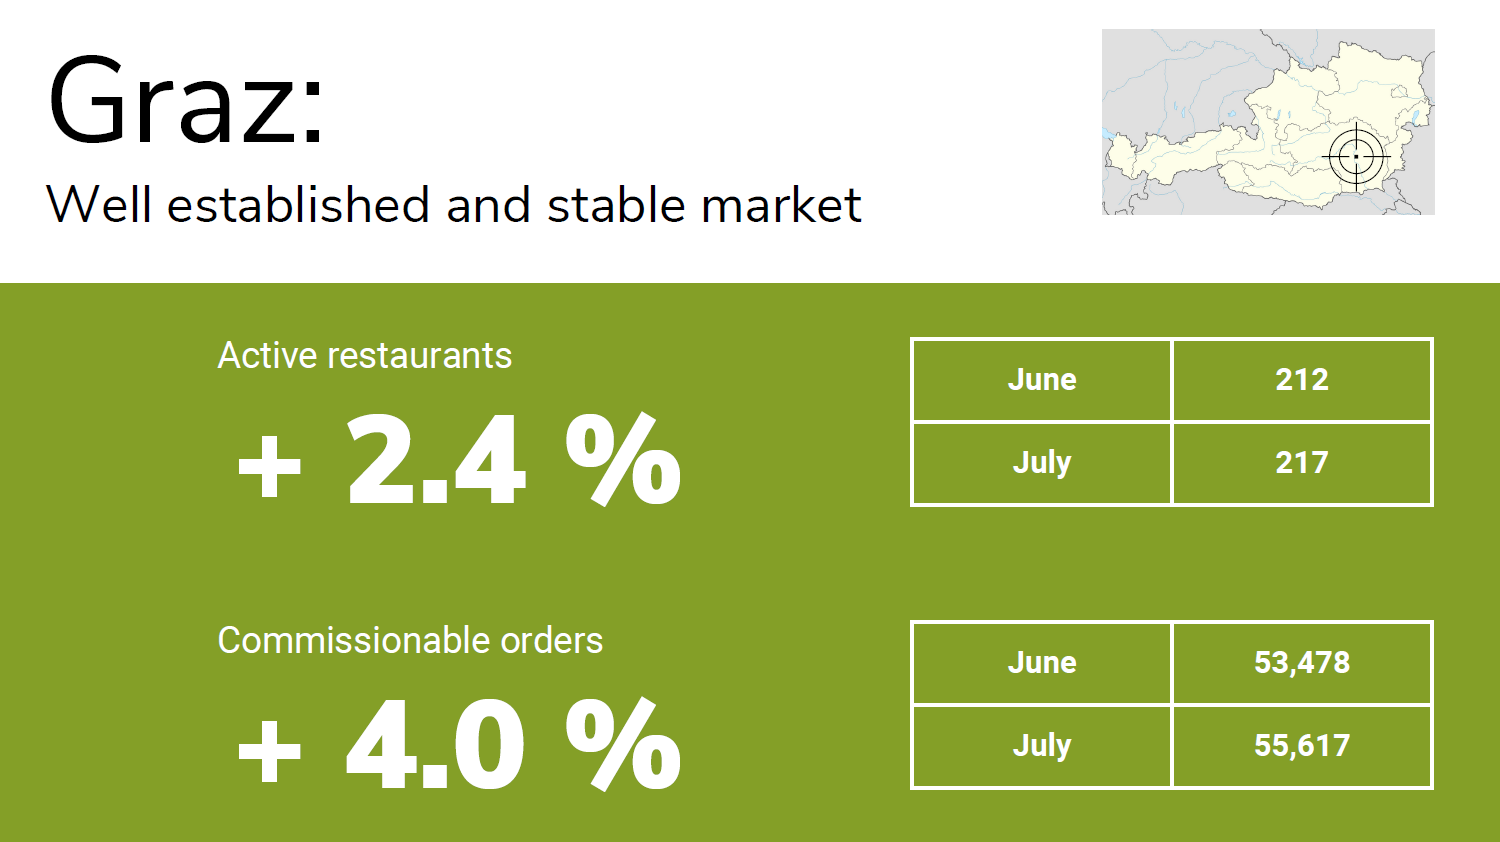
Fig 2. The number of restaurants active on Deliverando and the number of orders via the platform rose between the two months.
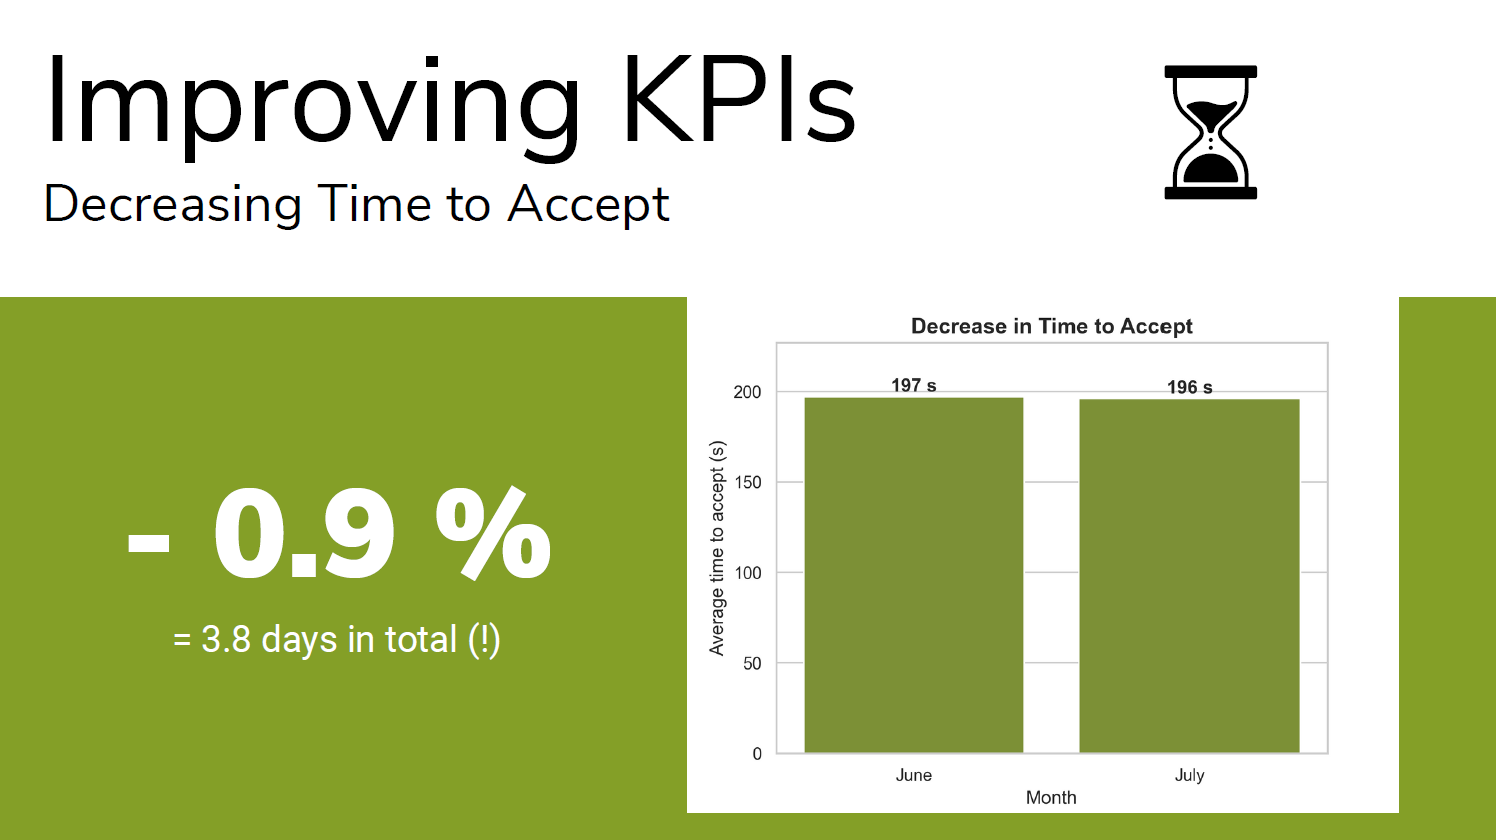
Fig 3. The registered restaurants managed to decrease the average time to accept an order which led to almost 4 days of insecurity less for our customers!
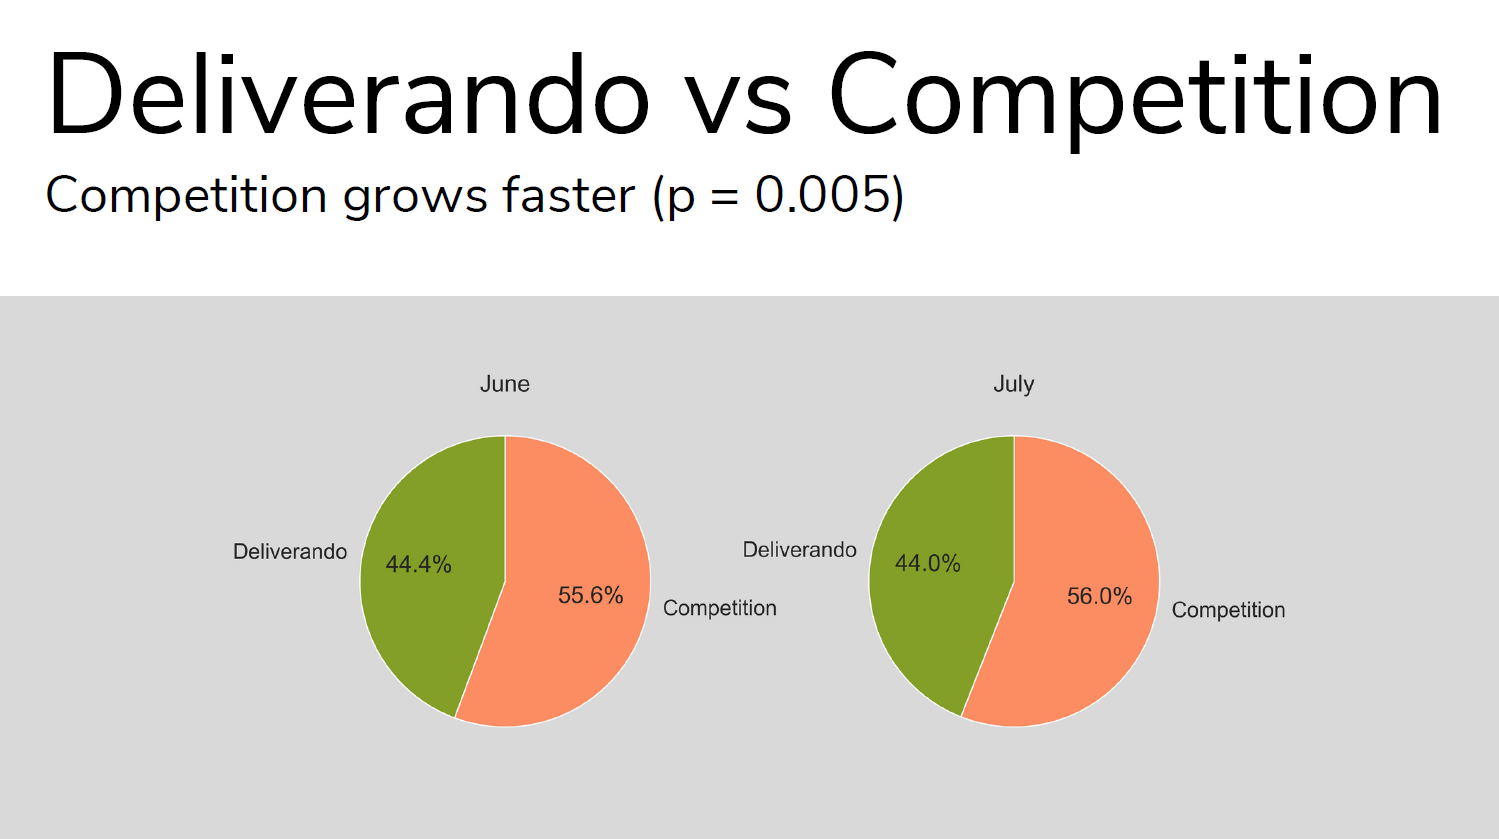
Fig 4. Despite the previous positive KPIs, the competitors rose slightly faster and we need to reflect it in our decision making.
Business proposals and next steps
Based on the findings, I proposed a number of measures and directions for further inquiries. The corresponding slide is shown in Fig 5.
-
Focus on the restaurants with room for improvement, e.g. restaurants only working with competition or restaurants important for competition (TOP10).
-
Investigate more about some KPIs. For example, the company should have more data on positive and negative comments, and we need to understand those better.
-
Analyze what caused the changes - new restaurants on the platform, or changes implemented in the original group?
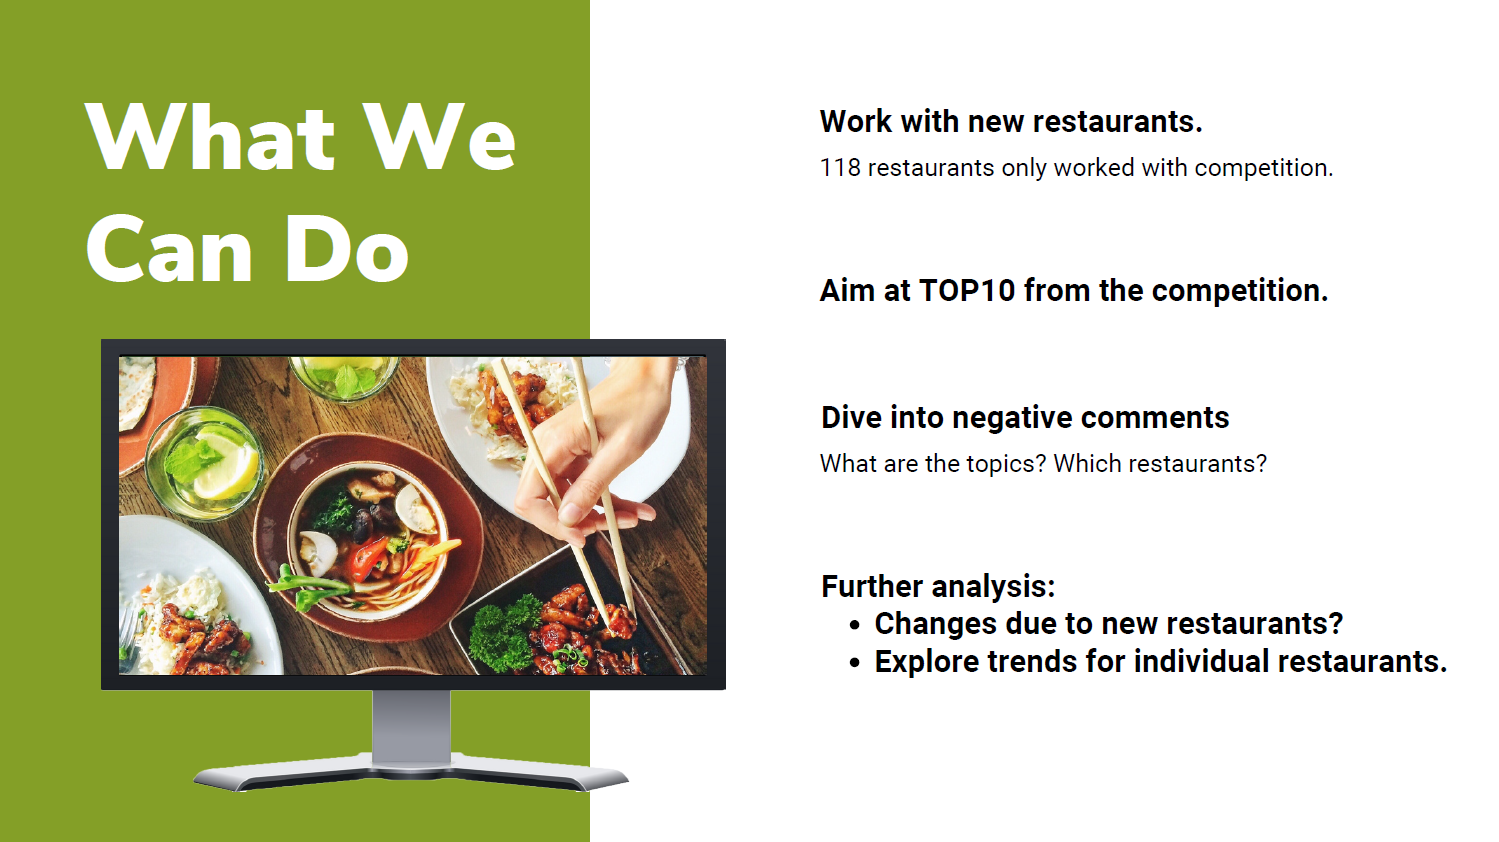
Fig 5. Suggestions for stakeholders.